Appearance
Introduction to Annotation
In this introduction, we provide a guide on the powerful annotation capabilities of Omics Studio. This guide covers essential aspects from getting started with annotations to advanced functionalities. Here's what you'll learn:
- Getting started: We'll guide you through the initial steps, setting the stage for using the annotation tool.
- Searching your data: Learn to efficiently locate the information you need using both simple and advanced search techniques.
- Sorting data: Discover how to sort data within tables by value or alphabetically to quickly find key findings or patterns.
- Selecting Items: Understand how to select and manage items within the different views, and how these selections can be integrated into your analysis workflow.
- Sending to Pathway Graph: Find out how to transfer selected pathways directly to the Pathway Graph for further analysis.
- Downloading data: Learn how to download your annotated data in CSV or Excel formats.
This introduction sets the stage for a detailed exploration of our annotation tool, ensuring you have the knowledge and skills to maximize the potential of your omics data analysis.
When to use annotations?
Annotations offers a profound layer of biological context to datasets. By linking transcripts and proteins with detailed information on their functions, cellular location, and pathways, annotations allows you to unravel the complex narratives recovered from bioinformatic databases. It provides knowledges, which could prove pivotal for identifying key biomarkers, understanding disease pathways, and pinpointing potential therapeutic targets, as it puts expression data into meaningful context, e.g., if you are looking for membrane bound metalloproteinase among you list of expressions of interest.
How to get started
To begin annotating your data, please follow these steps. You must have created and saved nodes (e.g., proteins) to a list in My Lists before annotating. If you're new to creating a My List, please refer to our dedicated guide here.
Select your Target list: From the dropdown menu, choose your list of interest. Options include your own custom lists (
My List), or nodes directly from yourPathway Graph. You can select specific nodes of interest in the Pathway Graph, marked as<sel>, or choose all nodes currently visible in the Pathway Graph, indicated by<graph>.
Annotate your list: When selected, click "Annotate" to initiate over representation analyses covering pathways, molecular function and cellular compartments.
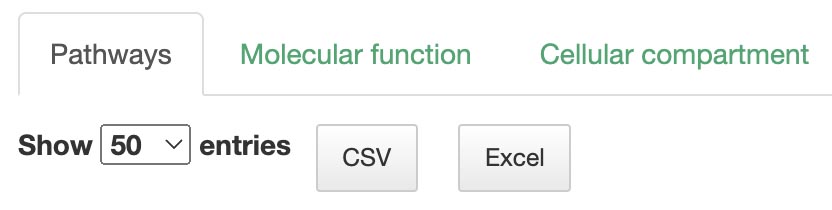
Choose your desired view —
Pathways,Molecular function, orCellular compartment— based on your specific research question.
💡 Learn more about the views
For detailed insights into the Pathways, Molecular Function, or Cellular Compartment views, please explore their respective documentation.
Search in your data
Our search functionalities are designed to enhance your data exploration, enabling you to quickly pinpoint the information you need. Here's how:
Simple search
Use the the search tool in the top right corner to easily find what you are looking for. The search tool enables you to quickly locate specific items within your data using keywords like identifiers (e.g., O075475), gene ratios (e.g., 20/20), p-values (e.g., 7.606e-60), and more.

Advanced search
For more refined searches, each category offers specialized search tools, allowing for multi-factor searches or range-based searches.
Search by keywords
ind data by specific keywords, such as an identifier (O075475), including:
- ID
- Description
- Gene ratio
- Bg Ratio
- p-value
- geneID
- Uniprot entry
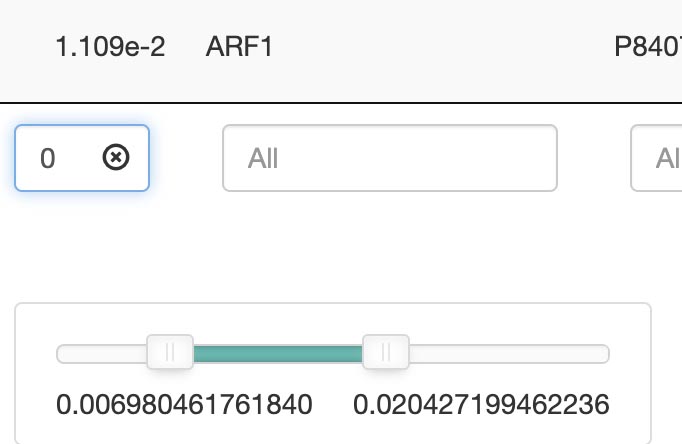
Search by keywords or ranges: Advanced options allow for range-based searches, such as a p-value between 1.14 and 1.66. A slider in the search bar can be used to adjust.
- p-value
- p.adjust
- q-value
- count
Sorting data
Omics Studio enables users to sort tables by the highest/lowest values or in alphabetical order (A-Z or Z-A).
Select items
Users can select items within any of the three views: Pathways, Molecular Function, and Cellular Compartment. Selection is as simple as clicking on one or more items. The filter menu displays your selections, neatly categorized by view, enabling a comprehensive overview of your current analysis focus.
Example
Selected pathways: Binding and entry of HIV virion, SUMOylation of DNA damage response and repair proteins, Gap-filling DNA repair synthesis and ligation in TC-NER, DNA Damage/Telomere Stress Induced Senescence, Early Phase of HIV Life Cycle
Selected molecular functions: GO:0005198, GO:0015026, GO:0019899, GO:0004190, GO:0003755, GO:0005261
Selected cellular compartments: GO:0098978, GO:0034774
Add selection to My List: Furthermore, selections from any of these views can be added directly to your My List(s) with the 📌 button, facilitating a more efficient workflow for managing and analyzing datasets. If you want to learn more about My Lists, follow this link.
Send to Pathway Graph
When operating within the Pathways view, you can easily transfer all selected pathways directly to the Pathway Graph. This seamless integration allows for an immediate and visual examination of your chosen pathways within the graph's dynamic environment.
⚠️ Please be aware that transferring pathways to the Pathway Graph replaces any previously selected pathways.
Download your data
Your data can be downloaded in CSV or Excel format, reflecting your preference and the specific tab you are viewing (Pathways, Molecular Function, or Cellular Compartment). Note that the download will include only the data visible at the moment, ensuring relevance and specificity to your search criteria.