Appearance
Node filters Pathway graph
Node filters are essential tools within the Pathway graph, designed to refine and tailor the visualization to your specific research thressholds. By applying these filters, you can streamline the data presented, focusing on specific nodes based on statistical significance, detection status, or expression changes.
Available filters
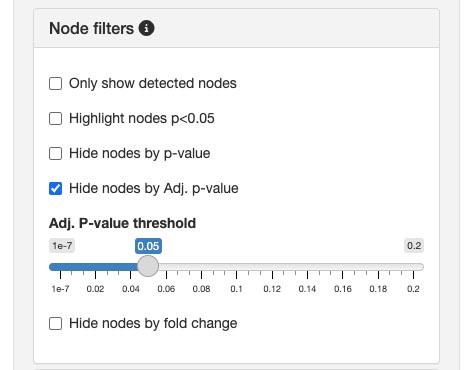
Only show detected nodesThis filter removes undetected nodes from the graph, allowing you to concentrate on nodes with observed expression.Highlight nodes (p < 0.05)Emphasizes nodes that have a p-value less than 0.05, indicating statistical significance. This feature aids in identifying potentially important nodes for further analysis.Hide nodes by p-value:Enables you to hide nodes that exceed a specific p-value threshold. By setting a cut-off, you can exclude nodes based on p-values.Hide nodes by adjusted p-value:Similar to the p-value filter, but uses the adjusted p-value (Adj. p-value) to account for multiple testing corrections. This ensures a more stringent selection of nodes.Hide nodes by fold change:Allows you to hide nodes that do not meet a certain fold change threshold. This is useful for focusing on nodes with significant changes in expression levels.
💡 Adjust the thresholds
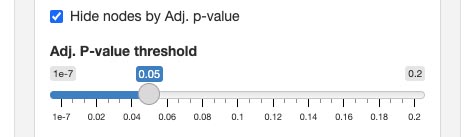
You can easily adjust the thresholds for both Hide nodes by adjusted p-value and Hide nodes by fold change. It allows for dynamic and precise setting of cut-off values, enabling you to fine-tune which nodes are displayed based on their statistical values or expression changes.
Adjusting the thresholds
For filters that hide nodes based on p-value, adjusted p-value, or fold change, you have the flexibility to define the cut-off thresholds. This customization ensures that the graph displays only the nodes that are most pertinent to your research criteria.
By utilizing Node filters, you can enhance the clarity and relevance of the Pathway graph, making it a more powerful tool for your omics data analysis.