Appearance
Data inspection introduction
In this guide, we cover essential aspects for getting started with Data inspection to advanced functionalities. Here's what you'll learn:
- Getting started: We'll guide you through the initial steps.
- Searching your data: Learn to efficiently locate the information you need using both simple and advanced search techniques.
- Sorting data: Discover how to sort data within tables by value or alphabetically to quickly find key findings or patterns.
- Selecting Items: Understand how to select and manage items within the different views, and how these selections can be integrated into your analysis workflow.
- Sending to Pathway Graph: Find out how to transfer selected pathways directly to the Pathway Graph for further analysis.
- Downloading data: Learn how to download your annotated data in CSV or Excel formats.
When to use data inspection
Data check: Data inspection is an essential tool to ensure that the loaded data is correct. Please check the p-values, fold changes, comparison annotations, etc., to avoid loading and formatting errors.
Contextualization: Data inspection also allows for selecting data to investigate and contextualize. Choose, e.g., the top 10 up- or down-regulation or the pathways of interest and start exploring.
How to get started
We recommend to created a new list in My Lists before getting started. This will allow you to save selected regulations. If you're new to creating a list in My Lists, please refer to our dedicated guide here.
To begin data inspecting your data, follow these two steps:
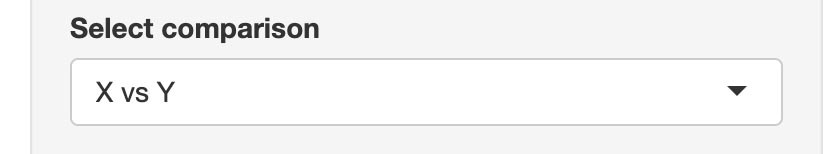
- Select your comparisons: Start with selecting a comparison of interest, e.g., "X vs Y".
- Choose your desired view —
Statistics,Enrichment, orRoutes— based on your specific research interests.
💡 Learn more about the views
For detailed insights into the Statistics, Enrichment, or Routes views, please explore their respective documentation.
Search in your data
Our search functionalities are designed to enhance your data exploration, enabling you to quickly pinpoint the information you need. Here's how:
Simple search
Use the the search tool in the top right to easily find what you are looking for. The search tool enables you to quickly locate specific items within your data using keywords like identifiers (e.g., O075475), fold change (e.g., 0.90), p-values (e.g., 7.606e-60), and more.

Advanced search
For more refined searches, each category offers specialized search tools in the bottom of the column, allowing for multi-factor searches or range-based searches. If you want to remove a specific factor from a multiple factor search, this can be accomblished by clicking on the (x) next to the factor.
Search by keywords
Find data by specific keywords, such as an identifier (O075475), including:
- ID
- Description
- Gene ratio
- Bg Ratio
- p-value
- geneID
- Uniprot entry
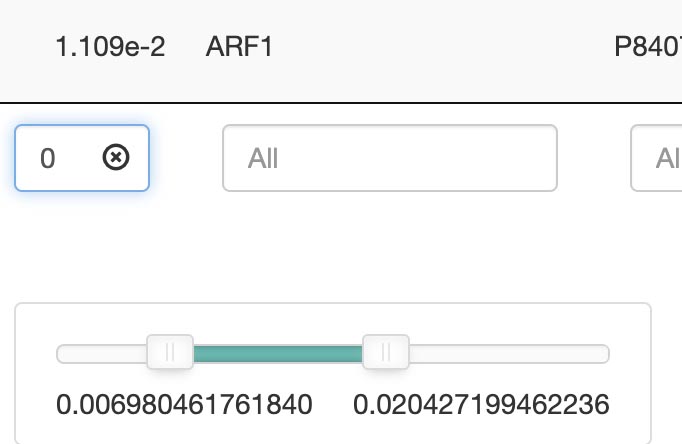
Search by keywords or ranges: Advanced options allow for range-based searches, such as a p-value between 1.14 and 1.66. A slider in the search bar can be used to adjust.
- p-value
- p.adjust
- q-value
- count
Sorting data
Each column in has a top/down arrow, which enables you to sort tables by the highest/lowest values or in alphabetical order (A-Z or Z-A).
Select items
You can select items within any of the three views: Statistics, Enrichment, and Routes. Selection is as simple as clicking on one or more items. The filter menu displays your selections, neatly categorized by view, enabling a, excellent overview of your current analysis focus. To deselect a specific selection, one only need to click on the selected item a second time.
Example
Selected IDs:
A0AVT1, A1IGU5, A2RRP1, A6ND01, A6NMU1, B1NKT1, O00115, O00116, O00139, O00141
Selected pathways:
Asparagine N-linked glycosylation, Cargo recognition for clathrin-mediated endocytosis, COPII-mediated vesicle transport
Select comparison
The select comparison allows you to choose which specific comparison the tabs should represent and swiftly switch between comparisons.
Clear selections
When you click Clear selections, it will remove all current selections across every view, including Statistics, Enrichment, and Routets. This action is global and not limited to the view you are currently working in.
Send to Pathway Graph
When operating within the Pathways view, you can easily select and transfer pathways directly to the Pathway Graph using the Send to Pathway Graph. This seamless integration allows for an immediate and visual examination of your chosen pathways within the graph's dynamic environment.
Add selection to Target list: Selections from the statistics view can be added directly to your List(s) with the 📌 button, facilitating a more efficient workflow for managing and analyzing datasets. If you want to learn more about Target Lists, follow this link.
⚠️ Please be aware that transferring pathways to the Pathway Graph replaces any previously selected pathways.
Statistics attributes
In the Statistics tab you will see the statistical information you have choosen to upload into Omics Studio. This can both be case-control and time studies.
Statistics — Attribute definitions
- Ids: Unique identifier for proteins in the UniProt database
- Uniprot ID: Unique identifier for proteins in the UniProt database
- Ensembl ID: Unique identifier for gene annotations in the Ensembl database
- Comparison: Comparison between different conditions or experiments
- Fold Change: Fold Change, indicates the ratio of expression changes between conditions
- log2 Fold Change: Logarithm of Fold Change, used for statistical analysis
- p-value: P-value, indicating the statistical significance of the results
- Adjusted p-value: Adjusted p-value, correcting for multiple statistical tests
Enrichment attributes
In the Enrichment tab you will see the information from the enrichment analysis you have choosen to upload into Omics Studio. Often respresentated by a over-representation analysis.
Enrichment — Attribute definitions
- ID: Unique identifier for the entry
- Description: Brief explanation or details of the entry
- Gene Ratio: Ratio of genes of interest to total genes
- Bg Ratio: Background ratio for comparison
- p-value: Statistical significance of the observed association
- p.adjust: Adjusted p-value accounting for multiple comparisons
- q-value: False discovery rate-adjusted p-value
- geneID: Unique identifier for genes involved
- Count: Number of genes associated with the entry
Search by keywords or ranges
Advanced options allow for range-based searches, such as a fold change 2.00 and 2.40, including ID, description, gene ratio, and more. A slider in the search bar can be used to adjust. See which attributes has the range-based search:
All — List of range-based attributes
Statistics
- fc: Fold Change, indicates the ratio of expression changes between conditions
- logfc: Logarithm of Fold Change, used for statistical analysis
- limma p-value: P-value from Limma package, assessing differential expression
- Wilcox p-value: P-value from Wilcoxon test, for non-parametric statistical comparison
- Shapiro-Wilk Normality Test p-value: P-value from Shapiro-Wilk test, assessing data normality
- Adj. limma p-value: Adjusted p-value from Limma, correcting for multiple testing
- Adj. Wilcox p-value: Adjusted p-value from Wilcoxon test, for multiple comparisons
Enrichment
- p-value: Statistical significance of the observed association
- p.adjust: Adjusted p-value accounting for multiple comparisons
- q-value: False discovery rate-adjusted p-value
- Count: Number of genes associated with the entry
Download your data
Your data can be downloaded in CSV or Excel format, reflecting your preference and the specific tab you are viewing. Note that the download will include only the data visible at the moment, ensuring relevance and specificity to your search criteria.